Yes, it looks like Victoria has passed the peak of its second wave. It probably did earlier than we think
- Written by Ian Marschner, Professor of Biostatistics, NHMRC Clinical Trials Centre, University of Sydney
It’s hard to recall a time when we didn’t nervously await the announcement of Victoria’s daily COVID-19 case numbers each morning.
It was certainly disconcerting when the state recorded more than 700 new cases on two occasions not long ago.
And likewise, now that we’ve seen a few consecutive days of around 300-400 cases, it’s tempting to ask whether the peak of Victoria’s second wave is behind us.
The good news is, current daily case numbers do indicate we’ve passed the peak of the second wave. But I would suggest we actually reached the peak at the end of July, and the reported case numbers are only now catching up.
Daily case numbers versus new infections
Before we can answer the question of whether Victoria has passed the peak of its second wave, we need to be clear about what we’re asking. Although it’s natural to focus on the reported case numbers because they’re highly visible, the outbreak’s progress is in fact driven by the number of new infections.
COVID-19 infections can take up to two weeks to be diagnosed and appear in the official case count. This is because an infected person must first pass through an incubation period (the time between becoming infected and symptoms presenting), and then be tested and wait for their result.
On average, the process takes about one week, but it can vary substantially from person to person.
So today’s case numbers — rather than indicating new infections — actually reflect infections that occurred up to two weeks ago.
In other words, watching the case numbers doesn’t tell us the full story about the current spread of the virus. When asking whether we’ve passed the peak, we really need to focus on the peak in daily infections.
That’s where data analytics come in
We don’t know how many new infections occur each day because infections remain hidden until symptoms develop or there’s some other reason for a person to get tested.
But we do have a good idea of how long it takes for someone to progress from infection to symptoms, and then from symptoms to diagnosis by a positive test.
By combining the observed case numbers with a mathematical model for the progress from infection to diagnosis, we can then reconstruct the pattern of past infections that would have led to the case numbers. This is an epidemiological analysis method called back-projection.
This analysis is an estimate, not an observation. But we can use it to explore whether there’s any evidence infection numbers have peaked, and at what point.
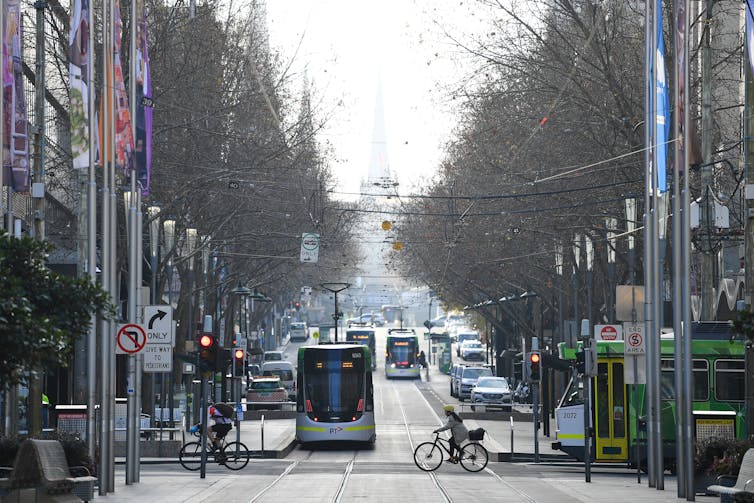 Melbourne’s tough restrictions appear to be working.
James Ross/AAP
Melbourne’s tough restrictions appear to be working.
James Ross/AAP
Looking back to the first wave
Earlier in the outbreak I used this approach to evaluate the effectiveness of the government’s control measures. In a study looking at the first wave of infections across Australia, I showed that the timing of government restrictions matched almost exactly with the flattening and downturn of infection numbers.
This was despite the fact case numbers continued to rise after restrictions were introduced. In other words, the case numbers were hiding the good progress that was going on in the background.
By clamping down early, we probably avoided tens of thousands of infections nationally. A recent study published in the Medical Journal of Australia estimated Victoria’s control measures averted between 9,000 and 37,000 cases in July.
Returning to Victoria’s second wave
We can use the same data analytics approach to explore the progress of the recent restrictions in controlling Victoria’s second wave.
My reconstruction of Victoria’s infection numbers during the second wave, shown below, illustrates an early rise in infections during June. This rise likely accelerated in the first half of July, when new infections would have been increasing at a substantially greater rate than was evident in the daily case numbers.
This lag in the case numbers makes it plausible the recent flattening of daily cases is being driven by a much more pronounced decrease in the underlying infection numbers. This is what the reconstructed infection numbers are suggesting in the graph, which shows a peak in late July.
Again, this is an estimate rather than an observation, and the very recent infection numbers have considerable uncertainty. (This is because we work backwards with this analysis, and very few of the most recent infections will have shown up yet in the case numbers.)
Room for optimism, but not complacency
The lower case numbers in recent days suggest we’ve reached and passed the peak of Victoria’s second wave, and my analysis strengthens and supports this. It shows a peak and decline in new infections over the last couple of weeks.
If this is true there’s good reason to be optimistic the tough restrictions will drive the infection curve, and subsequently the case numbers, down even further.
But it’s sobering that my same analyses estimate Victoria has had about 2,000 more infections than case diagnoses. That’s an estimated 2,000 people who are infected but don’t yet know it.
So even if new infections have peaked, as we all hope, there’s plenty of potential for the curve to turn back up again if adherence to the restrictions wavers. Victorians have some reason to be optimistic that the peak has passed, but there’s no room for complacency.
Authors: Ian Marschner, Professor of Biostatistics, NHMRC Clinical Trials Centre, University of Sydney