Who gets what? Who pays for it? How incomes, taxes and benefits work out for Australians
- Written by Peter Whiteford, Professor, Crawford School of Public Policy, Australian National University
The Australian Bureau of Statistics has just released its latest analysis of the effects of government benefits and taxes on household income. Overall, it shows government spending and taxes reduce income inequality by more than 40% in Australia. Disparities between the richest and poorest states are also greatly reduced.
The ABS analysis provides the most up-to-date (to 2015-16) and comprehensive figures on the impacts of government spending and taxes on income distribution. As well as direct taxes and social security benefits, it estimates the impact of “social transfers in kind” – goods and services that the government provides free or subsidises. These include government spending on education, health, housing, welfare services, and electricity concessions and rebates.
The figures also include a wide range of indirect taxes. Among these are GST, stamp duties and excises on alcohol, tobacco, fuel and gambling.
The 2015-16 results are the seventh in a series published every five to six years since 1984. The methodology is based on similar studies by the UK Office of National Statistics since the 1960s. The latest UK analysis coincidentally also came out on Wednesday.
How do the calculations work?
The ABS analyses income distribution in a number of stages.
First, it calculates the distribution of “private income”. This includes wages and salaries, self-employment, superannuation, interest, dividends and income from rental properties, among other items. It also includes net imputed rent from owner-occupied dwellings and subsidised private rentals.
Next the ABS adds social security benefits, such as the Age Pension, unemployment and family payments, to give “gross income”.
Then it deducts direct taxes – primarily income tax – to give “disposable income”.
The next stage is to add the estimated value households derive from government services. This is mainly the value of public health care and education spending.
The final stage is to deduct the estimated value of indirect taxes.
So what are the impacts on income inequality?
It is possible to calculate measures of economic inequality at different stages in this process. By implication, the difference between inequality measures is the result of the different government policies taken into account.
Figure 1 shows the Gini coefficient, which ranges between zero – where all households have exactly the same income – and 100% – where one household has all of the income. The Gini coefficient for private income in 2015-16 was 44.2. The addition of social security benefits, which mainly increase the incomes of low-income groups, reduces the coefficient by 8.1 percentage points.
Deducting income taxes – which are progressive – further reduces inequality by 4.5 points. Government non-cash benefits reduce the Gini coefficient by nearly as much as the social security system. However, indirect taxes slightly increase income inequality.
The Gini coefficient for final income is 24.9. So, compared to a coefficient of 44.2 for private income, government spending and taxes reduce overall income inequality by more than 40%.
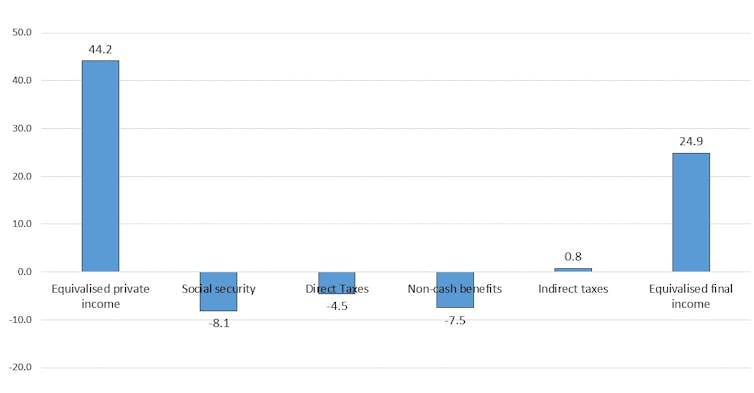 Figure 1: Effects of government spending and taxes on income inequality, measured by Gini coefficient Australia 2015-16.
Data source: ABS Government Benefits, Taxes and Household Income, Australia, 2015-16, Author provided
While most of the reduction in inequality is due to government spending, taxes are obviously important to pay for this spending.
The social security system reduces income inequality (and poverty) because Australia targets benefits to the poor more than in any other high-income country.
Figure 2 shows the distribution of social security benefits and government services across income groups, from the poorest 20% to the richest 20% of households. The poorest 20% receive about seven times as much in benefits as the richest 20%. The average for OECD countries is close to one, with rich and poor receiving about the same amount.
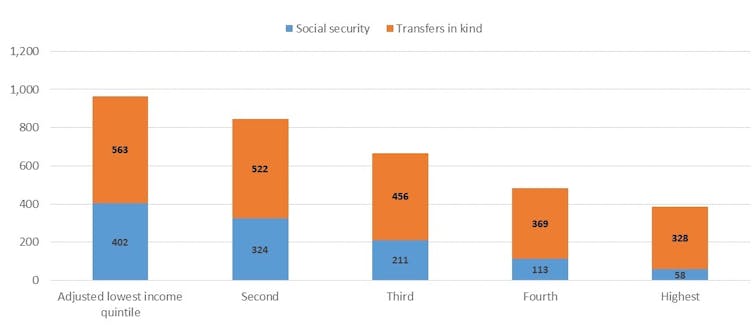 Figure 2: Distribution of social spending ($ per week) by equivalised disposable household income quintiles, Australia 2015-16.
Data source: ABS Government Benefits, Taxes and Household Income, Australia, 2015-16, Author provided
Government spending on social services is also progressively distributed. This spending is considerably greater than social security spending and includes both Commonwealth and state spending on education and health.
The poorest 20% receive about 70% more in non-cash benefits than do the richest. This is not due to income-testing. Instead, it’s largely a result of the greater value of public health spending on hospitals and Medicare for older people, who tend to be in the bottom half of the income distribution.
Taxes, of course, work to reduce income inequality, as high-income groups pay a higher share than low-income groups. Figure 3 shows that the poorest 20% pay about 5% of their disposable income in direct taxes, while the richest 20% pay about 30% of their disposable income.
In contrast, indirect taxes – particularly those on tobacco and gambling – are regressive. Low-income groups pay more than high-income groups as a share of their disposable income. However, the undesirable effects of smoking and gambling on the wellbeing of low-income households need to be borne in mind.
When direct and indirect taxes are added together the overall tax system is less progressive, but the richest 20% still pay nearly twice as much of their disposable income as do the poorest 20%.
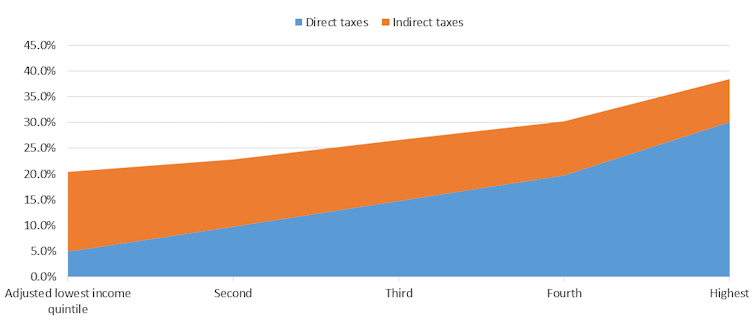 Figure 3: Distribution of direct and indirect taxes (% of disposable income) by equivalised disposable household income quintiles, Australia 2015-16.
Data source: ABS Government Benefits, Taxes and Household Income, Australia, 2015-16, Author provided
Redistribution also happens between age groups and states
In addition to reducing inequalities between income groups, government spending and taxes redistribute across age groups. Government spending is much higher for households of Age Pension age than for younger households. This is because of both the Age Pension and older households’ use of the healthcare system.
For example, households where the reference person is 75 or older receive on average just over $1,000 a week in government spending but pay about $180 a week in direct and indirect taxes. Households with a person aged 45 to 54 pay the highest taxes on average – about $800 per week – and on average receive about $620 a week in social spending.
There is also redistribution across states and territories. For example, average private income is about 65% higher in Western Australia than in Tasmania. However, on average, Western Australian households receive about two-thirds of the social security benefits that Tasmanian households get. This reduces the disparity in gross income to about 45%.
Western Australian households pay about twice as much in income taxes as Tasmanians, reducing the disparity to 35%. Households in the West receive only about 3% more in spending on social services than in Tasmania, which reduces the disparity in average incomes to 28%. West Australian households also pay about 20% more in indirect taxes than Tasmanian households (although as a percentage of disposable income, this is a higher share in Tasmania).
These figures suggest that while the financing of fairly equal social services across most parts of Australia reduces inequality between states, the income tax and social security systems also significantly reduce disparities. This is because income tax and social security are national systems and because Tasmania is the poorest state largely due to the higher share of age pensioners in its population.
Overall, this publication provides an invaluable picture of how government spending and taxes affect household economic well-being. Its results are relevant not only to the political debate about tax cuts, but also to long-term policy development to prepare Australia for an ageing population.
Authors: Peter Whiteford, Professor, Crawford School of Public Policy, Australian National University


