

Six images reveal how we ‘see' data and capture invisible science
- Written by Andrea Rassell, Nanoartist and creative-practice based researcher in Media, RMIT University
As an experimental video-maker working at scales smaller than molecules, I surround myself in a variety of scientific visualisations.
In reading popular media on scientific discoveries, I sometimes encounter claims that a particular scientific visualisation is, in fact, a photograph, for example: “first ever photograph inside a hydrogen atom”.
Read more: Looking at the universe through very different 'eyes'
A photograph is an image made from photons of light reflecting off an object and striking a photosensitive surface such as a film or a digital sensor. Because light carries information relating to shape, texture and colour, photographs are representations (images of the object) that retain some semblance of the original.
However, we live in a post-photographic world; a world in which visualisations use different ways of “seeing” data and scientific phenomena.
The following visualisations cover a range of scales, from geological to quantum. They were made using techniques that illustrate the vast differences between the processes of photography and scientific visualisation – and in some cases the potential for blending the two.
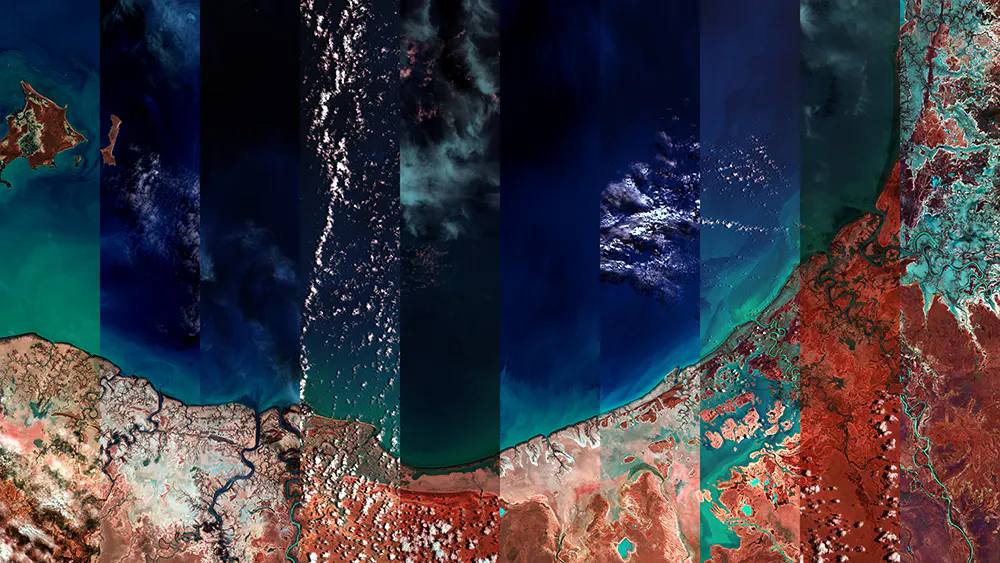
1. Australia from 700km above Earth
 12 months Over the Gulf of Carpentaria.
Grayson Cooke, Author provided (No reuse)
12 months Over the Gulf of Carpentaria.
Grayson Cooke, Author provided (No reuse)
Grayson Cooke is a media artist working with data from satellites in low Earth orbit. These satellites have sensors that record electromagnetic radiation, including ultraviolet, infrared and visible wavelengths of light.
This still image, from Cooke’s Open Air project, is made up of multiple frames captured over a year over the Gulf of Carpentaria, and combines infrared and visible wavelengths.
This image can be considered part photograph, because it is partially made using visible light. But it is also part data visualisation, because it utilises invisible infrared radiation, data that has been given the visible quality of colour.
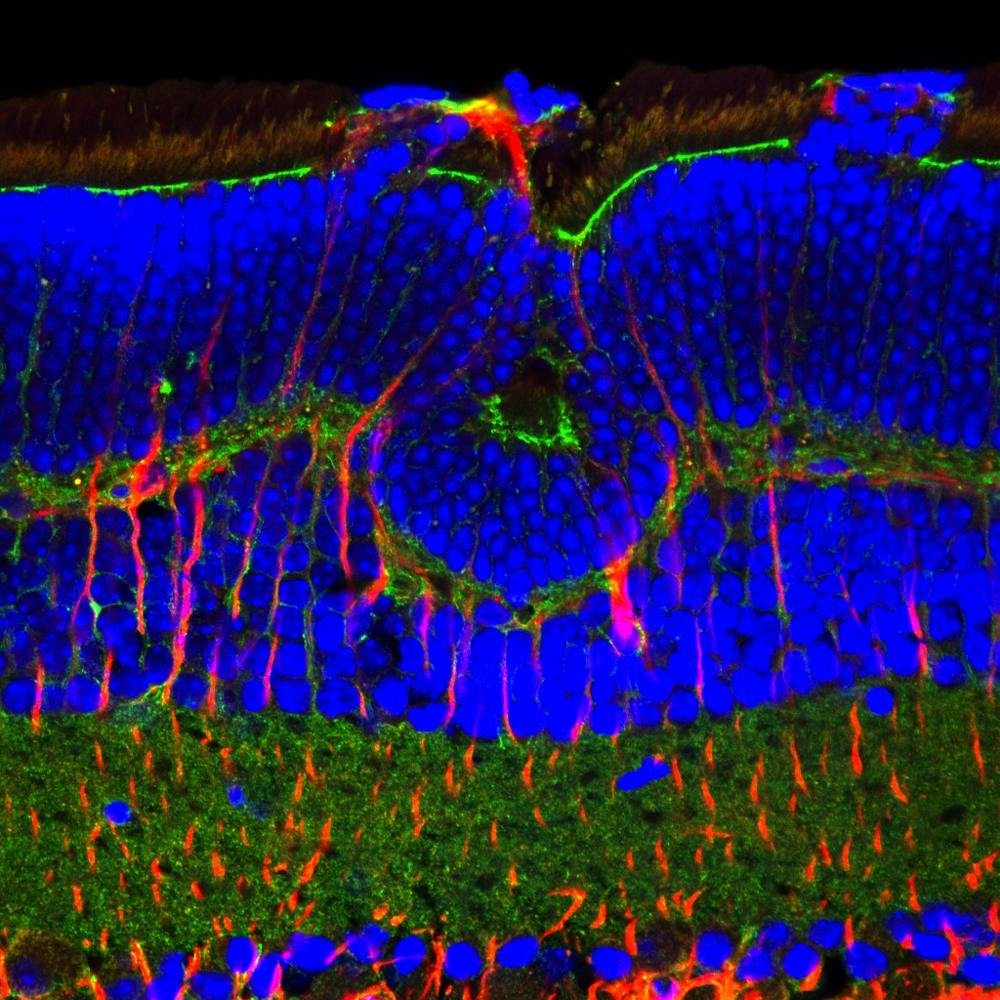
2. Fluorescing rat retina
 On the other side of a molecular divide, digital micrograph (2013)
Andrea Rassell, Author provided (No reuse)
On the other side of a molecular divide, digital micrograph (2013)
Andrea Rassell, Author provided (No reuse)
Confocal microscopy is a technique that uses fluorescent dyes — commercially manufactured antibodies with fluorescent molecules attached — to specifically bind to cell and tissue proteins in biological specimens. The fluorescent molecules become visible when they are excited by lasers from the microscope, and can be imaged using a photodetector or a camera.
In this example of a rat retina, different cell-surface proteins have been targeted, and antibodies with coloured molecules have been used to differentiate the types of cell in the retina, revealing the layered structure of the tissue. The image is a photo of fluorescent molecules, but not directly of the tissue itself.
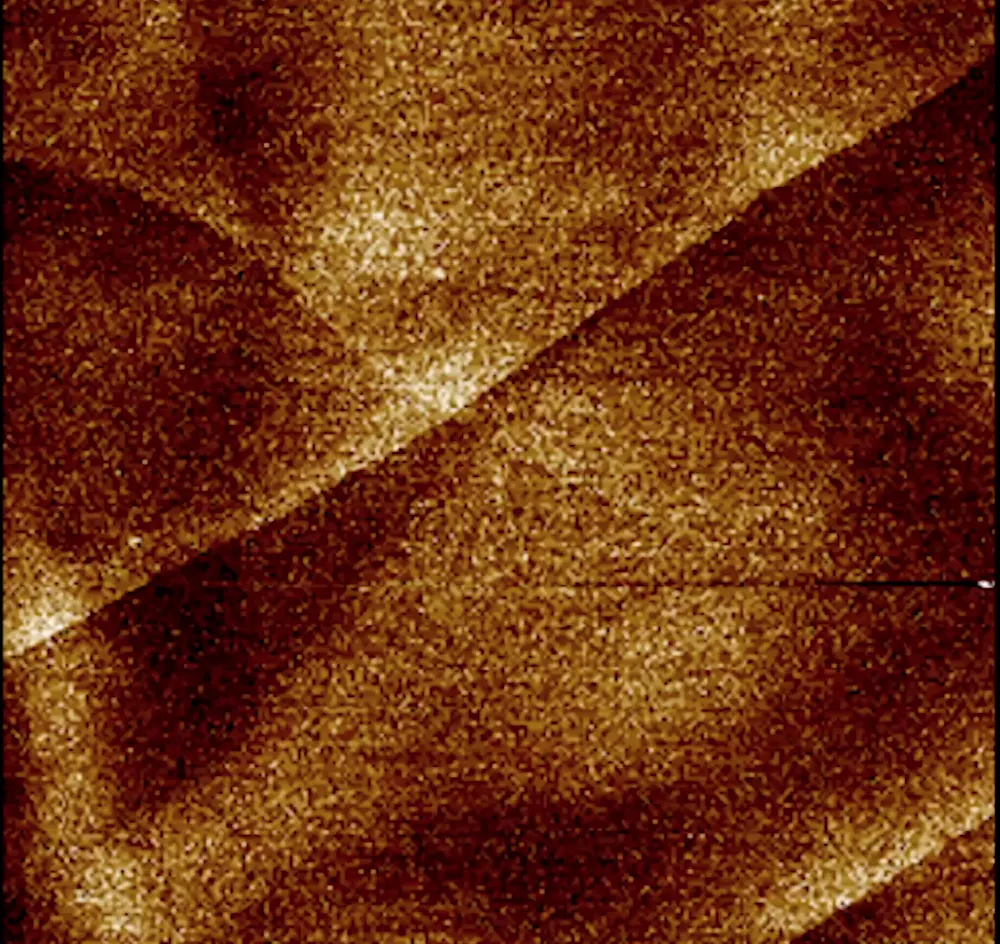
3. Graphene under an atomic force microscope
 Video still from Movement I: Nanomorphology (2018)
Andrea Rassell, Author provided (No reuse)
Video still from Movement I: Nanomorphology (2018)
Andrea Rassell, Author provided (No reuse)
Above is a micrograph of graphene, a substance with multiple layers of carbon lattices stacked like sheets of paper. The image was taken with an atomic force microscope.
Microscopic imaging is traditionally a direct optical image-capture process. Light waves are reflected off an object and amplified via lenses in the microscope, allowing the viewer to directly observe details in a magnified state.
However, this process does not work for phenomena at the nanoscale (a nanometre is one-billionth of a metre). Light waves in the visible spectrum are too large to strike objects under 400 nanometres in size, and therefore cannot be reflected back to be captured by a light microscope.
The atomic force microscope uses an alternative method of detection — a probe that functionally resembles a stylus on a record player, to scan and “feel” its way across a sample.
The sharpness of the probe tip, typically a few nanometres wide, determines the resolution of the micrograph. This allows visualisation of phenomena smaller than anything that could be detected with light.
The spatial data the instrument produces — values corresponding to depth, width and height — are translated via a number of instrumental and computational processes to create the micrographs. This process translates tactile data into visual data.
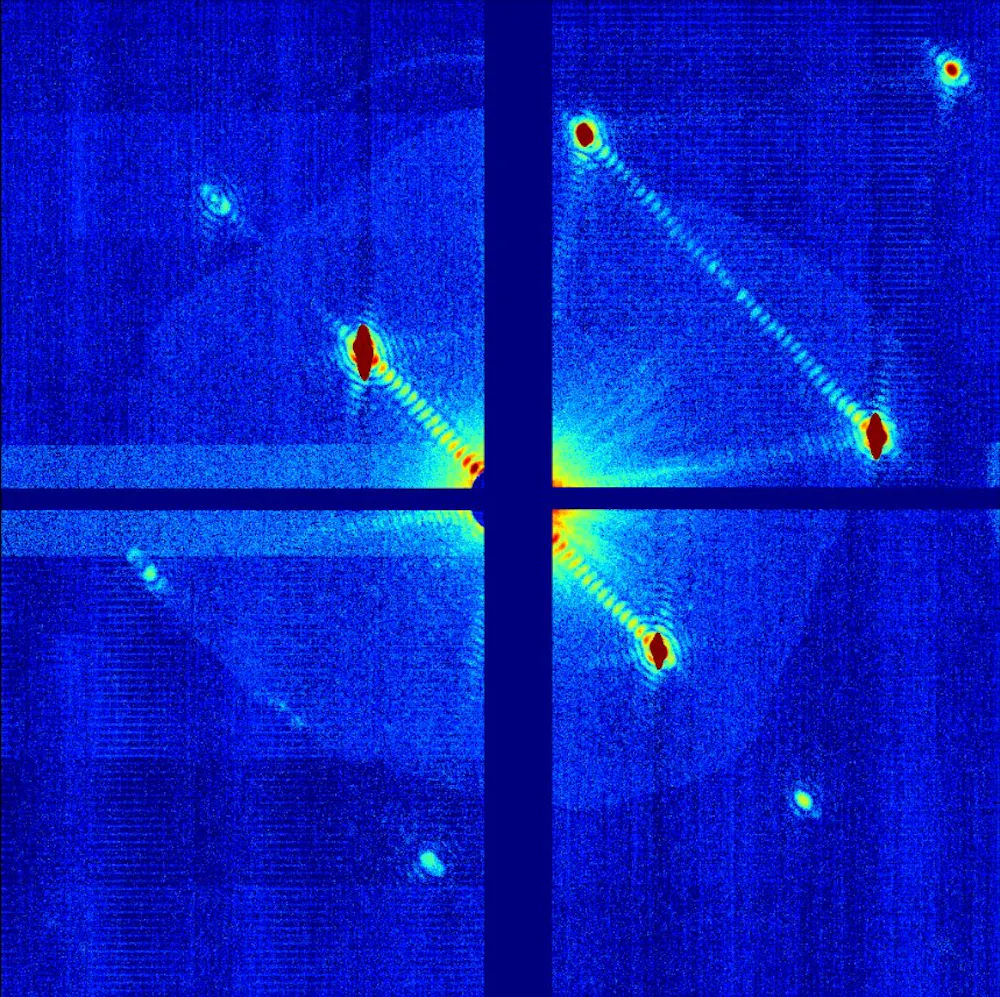
4. X-rays scattered by a protein
 Nanocrystallography of the GroEL protein (2011)
Andrew Martin, Author provided (No reuse)
Nanocrystallography of the GroEL protein (2011)
Andrew Martin, Author provided (No reuse)
X-ray scattering simulations are a common technique for determining the form of a molecule. This example shows a simulation of the X-ray scattering pattern of a protein (known as GroEL), which is about 60,000 atoms (10 nanometres) in diameter.
This type of visualisation is created when a beam of X-rays is directed at a protein sample. The X-rays scatter, changing direction depending on their interaction with the atoms in the protein. These atoms may be more or less dense in certain areas.
The patterns of the X-ray scattering can be measured and reverse-engineered to figure out the structure of the protein that created them. Crystallographers use computational analysis to recover the three-dimensional structure of the protein.
5. Theoretical images of molecules
 Fluorobenzene, calculated image (2011)
Ula Alexander, Author provided (No reuse)
Fluorobenzene, calculated image (2011)
Ula Alexander, Author provided (No reuse)
This is a calculated image of a fluorobenzene molecule at 25℃.
Calculated images are used to determine the changes that occur during a molecule’s rotation as it interacts with light. They are made using data from experiments, and the information in the calculation is modified until the calculated pattern matches the experimental one.
The image is a probability map of how likely the molecule is to absorb and emit light, and the artificial colourisation is assigned based on how likely this is. This is dependent on the molecule’s shape, the atomic vibration inside the molecule, and the rotation of the molecule in space.
The image is constructed from a series of horizontal one-dimensional images, which are stacked together to form the two-dimensional pattern. Following the dots in any of these series is like following an energy ladder corresponding to the initial amount of rotation of the molecule.
If the molecules are cold, and therefore not rotating much, these series are short, whereas warmer, faster rotating molecules will create a longer series of dots.
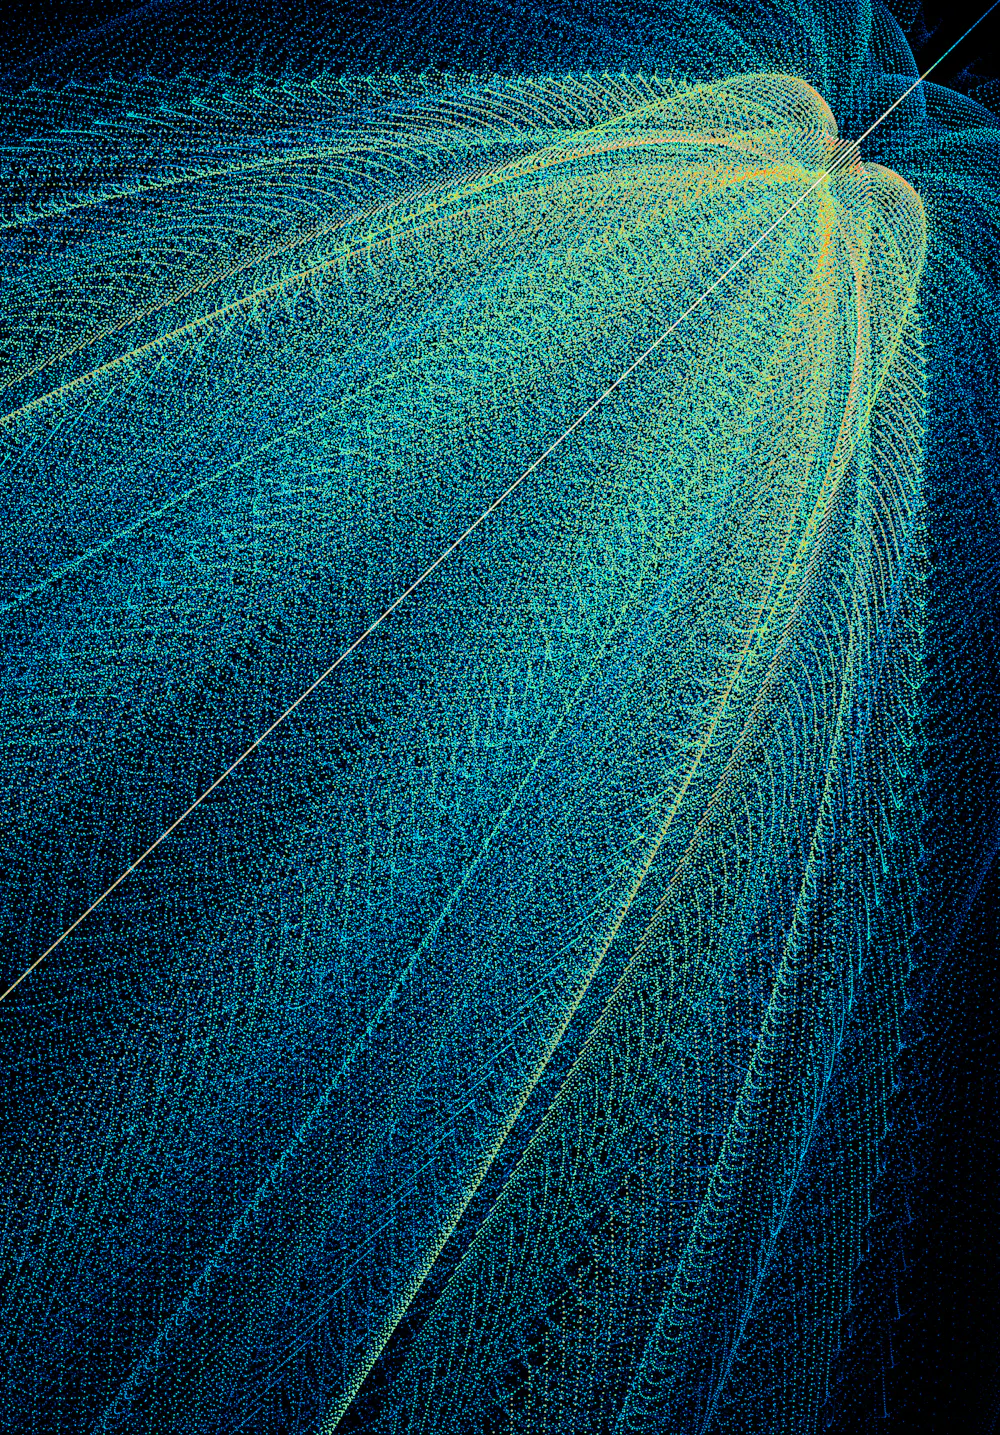
6. Bubble pathways of particles
 Neutrino interaction in the Fermilab 15-foot Bubble Chamber (1976)
Fermilab
Neutrino interaction in the Fermilab 15-foot Bubble Chamber (1976)
Fermilab
A bubble chamber is a cylinder filled with pressurised liquid that forms bubbles in response to particles moving through it. While the particles themselves cannot be photographed, these paths of bubbles can.
Particle beams flow into the chamber, and the formed bubbles are allowed to grow to about 1mm before flash photographs are taken from multiple angles.
Through looking at how these “images” are constructed, we can see that they are often not really images at all in the traditional sense of the word.
Rather than capturing “how something looks”, data visualisation involves translation of a feature into a visual form, or by finding a physical process that can be visualised.
Sitting alongside these images of complex, small-scale scientific phenomena are numerical data, tables, graphical representations and interpretations. And so perhaps it is true that scientific visualisations alone cannot represent what is, but merely give a sense of what is.
Authors: Andrea Rassell, Nanoartist and creative-practice based researcher in Media, RMIT University
Read more http://theconversation.com/six-images-reveal-how-we-see-data-and-capture-invisible-science-102769


