
Global carbon emissions inch upwards in 2024 despite progress on EVs, renewables and deforestation
- Written by: Pep Canadell, Chief Research Scientist, CSIRO Environment; Executive Director, Global Carbon Project, CSIRO
Carbon dioxide (CO₂) emissions from fossil fuels continue to increase, year on year. This sobering reality will be presented to world leaders today at the international climate conference COP29 in Baku, Azerbaijan.
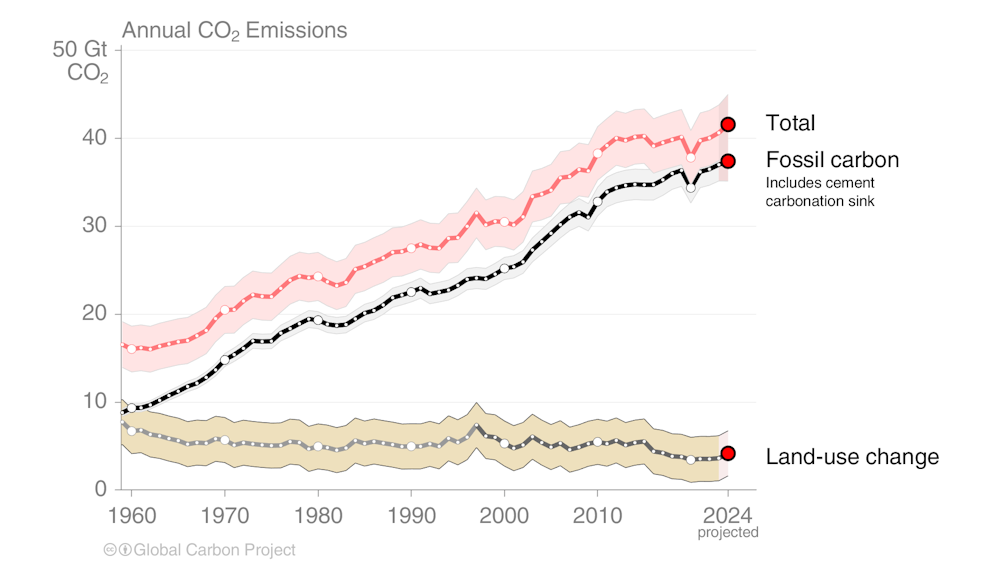
Our latest annual stocktake shows the world is on track to reach a new record: 37.4 billion tonnes of CO₂ emitted from fossil fuels in 2024. This is an increase of 0.8% from the previous year.
Adopting renewable energy and electric vehicles is helping reduce emissions in 22 countries. But it’s not enough to compensate for ongoing global growth in fossil fuels.
There were also signs in 2023 suggesting natural systems may struggle to capture and store as much CO₂ in the future as they have in the past. While humanity is tackling deforestation and the growth in fossil CO₂ emissions is slowing, the need to reach an immediate peak and decline in global emissions has never been so acute.
The Global Carbon Project
The Global Carbon Budget is an annual planetary account of carbon sources and sinks, which soak up carbon dioxide and remove it from the atmosphere.
We include anthropogenic sources from human activities such as burning fossil fuels or making cement as well as natural sources such as bushfires.
When it comes to CO₂ sinks, we consider all the ways carbon may be taken out of the atmosphere. This includes plants using CO₂ to grow and CO₂ being absorbed by the ocean. Some of this happens naturally and some is being actively encouraged by human activity.
Putting all the available data on sources and sinks together each year is a huge international effort involving 86 research organisations, including Australia’s CSIRO. We also use computer models and statistical approaches to fill out the remaining months to the end of the year.
Fossil fuel emissions up
This year’s growth in carbon emissions from fossil fuels is mainly from fossil gas and oil, rather than coal.
Fossil gas carbon emissions grew by 2.4%, signalling a return to the strong long-term growth rates observed before the COVID pandemic. Gas emissions grew in most large countries, but declined across the European Union.
Oil carbon emissions grew by 0.9% overall, pushed up by a rise in emissions from international aviation and from India.
The rebound in international air travel pushed aviation carbon emissions up 13.5% in 2024, although it’s still 3.5% below the pre-COVID 2019 level.
Meanwhile, oil emissions from the United States and China are declining. It’s possible oil emissions have peaked in China, driven by growth in electric vehicles.
Coal carbon emissions went up by 0.2%, with strong growth in India, small growth in China, a moderate decline in the US, and a large decline in the European Union. Coal use in the US is now at its lowest level in 120 years.
The United Kingdom closed its last coal power plant in 2024, 142 years after the first one was opened. With strong growth in wind energy replacing coal, the UK CO₂ emissions have almost been cut in half since 1990.
Changing land use
Carbon emissions also come from land clearing and degradation. But some of that CO₂ can be taken up again by planting trees. So we need to examine both sources and sinks on land.
Global net CO₂ emissions from land use change averaged 4.1 billion tonnes a year over the past decade (2014–23). This year is likely to be slightly higher than average with 4.2 billion tonnes, due to drought and fires in the Amazon. That amount represents about 10% of all emissions from human activities, the rest owing to fossil fuels.
Importantly, total carbon emissions – the sum of fossil fuel emissions and land-use change emissions – have largely plateaued over the past decade, but are still projected to reach a record of just over 41 billion tonnes in 2024.
The plateau in 2014–23 follows a decade of significant growth in total emissions of 2% per year on average between 2004 and 2013. This shows humanity is tackling deforestation and the growth of fossil CO₂ emissions is slowing. However, this is not enough to put global emissions on a downward trajectory.
More countries are cutting emissions – but many more to go
Fossil CO₂ emissions decreased in 22 countries as their economies grew. These countries are mainly from the European Union, along with the United States. Together they represent 23% of global fossil CO₂ emissions over the past decade (2014–23).
This number is up from 18 countries during the previous decade (2004–13). New countries in this list include Norway, New Zealand and South Korea.
In Norway, emissions from road transport declined as the share of electric vehicles in the passenger car fleet grew – the highest in the world at over 25% – and biofuels replaced fossil petrol and diesel. Even greater reductions in emissions have come from Norway’s oil and gas sector, where gas turbines on offshore platforms are being upgraded to electric.
In New Zealand, emissions from the power sector are declining. Traditionally the country has had a high share of hydropower, supplemented with coal and natural gas. But now wind and particularly geothermal energy is driving fossil generation down.
We are projecting further emissions growth of 0.2% in China, albeit small and with some uncertainty (including the possibility of no growth or even slight decline). China added more solar panels in 2023 than the US did in its entire history.
 Individual country emissions vary widely, but there are some signs of progress towards decarbonisation.
Global Carbon Budget 2024/Global Carbon Project, CC BY-ND
Individual country emissions vary widely, but there are some signs of progress towards decarbonisation.
Global Carbon Budget 2024/Global Carbon Project, CC BY-ND
Nature shows troubling signs
In the 1960s, our activities emitted an average of 16 billion tonnes of CO₂ per year globally. About half of these emissions (8 billion tonnes) were naturally removed from the atmosphere by forests and oceans.
Over the past decade, emissions from human activities reached about 40 billion tonnes of CO₂ per year. Again, about half of these emissions (20 billion tonnes) were removed.
In the absence of these natural sinks, current warming would already be well above 2°C. But there’s a limit to how much nature can help.
In 2023, the carbon uptake on land dropped 28% from the decadal average. Global record temperatures, drought in the Amazon and unprecedented wildfires in the forests of Canada were to blame, along with an El Niño event.
As climate change continues, with rising ocean temperatures and more climate extremes on land, we expect the CO₂ sinks to become less efficient. But for now, we expect last year’s land sink decline will recover to a large degree as the El Niño event has subsided.
 About half of the CO₂ emissions were removed from the atmosphere by forests and oceans. When we tally up all of the sources compared to the sinks, the budget should balance. We find a slight imbalance of 1.6Gt/year due to limitations of the data.
Global Carbon Budget 2024/Global Carbon Project, CC BY
About half of the CO₂ emissions were removed from the atmosphere by forests and oceans. When we tally up all of the sources compared to the sinks, the budget should balance. We find a slight imbalance of 1.6Gt/year due to limitations of the data.
Global Carbon Budget 2024/Global Carbon Project, CC BY
Looking ahead
Our latest carbon budget shows global fossil fuel emissions continue to increase, further delaying the peak in emissions. Global CO₂ emissions continue to track in the middle of the range of scenarios developed by the Intergovenmental Panel on Climate Change (IPCC). We have yet to bend the emissions curve into the 1.5–2°C warming territory of the Paris Agreement.
This comes at a time when it’s clear we need to be reducing emissions, to avoid worsening climate change.
We also identified some positive signs, such as the rapid adoption of renewable energy and electric cars as they become cheaper and more accessible, supporting the march toward a net-zero emissions pathway. But turning these trends into global decarbonisation requires a far greater level of ambition and action.
Authors: Pep Canadell, Chief Research Scientist, CSIRO Environment; Executive Director, Global Carbon Project, CSIRO