
Three charts on: the changing status of Indigenous Australians
- Written by: Nicholas Biddle, Associate Professor, ANU College of Arts and Social Sciences, Australian National University
A new dataset has shed fresh light on the changing socioeconomic status of Indigenous Australians. It shows that what appears to be slow progress or steady outcomes for the whole population may be masking worsening results.
This stems from how the Indigenous population is counted in the census and in surveys, and how that identification might change over time.
In each survey or census, people are asked to indicate if they are of Aboriginal or Torres Strait Islander origin. If they move in or out of the group classified as Indigenous, then this can appear in the aggregate as if people’s life-chances are changing. Rather, this may be an artefact of the group’s changing composition.
Flows into and out of the Indigenous population
Between 2011 and 2016, the best estimate of the Indigenous population grew by 128,500, or around 19%. This was due to a greater number of births than deaths, but also partly due to changes in how people were identified (either by themselves or others) as being of Indigenous origin.
There are many good reasons why Indigenous people may choose not to disclose their ancestry. These are often of a highly personal nature, especially given Australia’s history of discrimination against Indigenous people.
A decision to identify as Indigenous (or not) in the census should not be interpreted as a reflection on someone’s Indigenous identity, which is a separate matter from what box gets ticked on a census form. But the box-ticking does inform the government’s understanding of the Indigenous population – including monitoring progress against Closing the Gap targets.
Read more: Three reasons why the gaps between Indigenous and non-Indigenous Australians aren't closing
Using the data, we can identify three groups of Indigenous people in the 2011 and 2016 censuses:
the “always identified” - those who identified as Indigenous in both censuses;
the “formerly identified” – those who identified as Indigenous in the 2011 census but not the 2016 census; and
the “newly identified” – those who did not identify as Indigenous in the 2011 census, but who did identify as such in the 2016 census.
The figure below gives our best estimate of the flows that constitute these populations, and estimated births and deaths over the period.
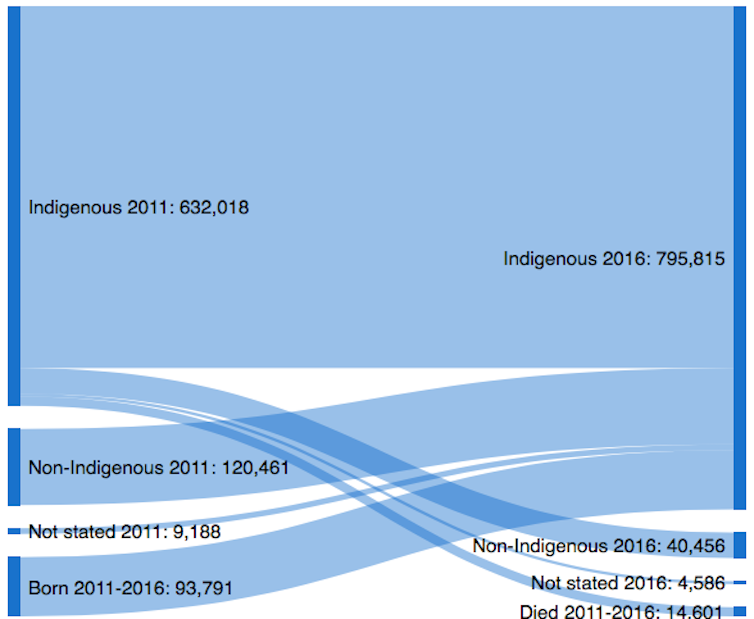 Indigenous population flows, 2011-2016.
Authors/Australian Bureau of Statistics
Indigenous population flows, 2011-2016.
Authors/Australian Bureau of Statistics
The largest of these three groups is the 572,400 people who identified as being of Indigenous origin in both the 2011 and 2016 censuses. This is the population we usually think about when analysing and interpreting Indigenous socioeconomic and demographic change.
However, two other groups were also quite large. There were 45,000 people in Australia who identified as Indigenous in the 2011 Census, but who didn’t identify as such in the 2016 Census. While this is a large number relative to the 2011 population estimate, the newly identified number is larger still (129,600).
The net increase from identification change was therefore estimated to be 84,600. This is equivalent to 13.7% of the Indigenous population in 2011.
The geography of identification change
The vast majority of those who changed how they identified their Indigenous origins in the census lived in urban parts of Australia in 2011. There are significant differences in the level of change in each of Australia’s eight states and territories.
Changing answers to the census question on Indigenous origin had a particularly pronounced impact on Indigenous population estimates in three jurisdictions – Victoria (21.5%), the Australian Capital Territory (20.9%), and New South Wales (20.8%).
However, because NSW had a relatively large Indigenous population in 2011 relative to Victoria and the ACT, net identification change in that state made up 48% of the total identification change. This is almost double the next greatest contribution – Queensland, which contributed 24.3%.
This may have implications for the distribution of GST revenue between the states and territories.
The relationship between socioeconomic and demographic change
Changes to the way people answer the census question on Indigenous origin has the potential to impact on the understanding of change in Indigenous socioeconomic outcomes.
If those who newly identified in the census had higher relative socioeconomic status before their identification changed, then this will tend to bias upward any measured change in socioeconomic outcomes.
Looking at all Indigenous adults aged 15 years and above at the time of each census, the employment rate in 2011 was 49.7%, while for the same measure in 2016 it was 50.4%.
If we only used repeated cross-sections, we would think that Indigenous employment is improving, albeit relatively slowly. But when we look at the employment rates using the linked population, a very different picture emerges.
The employment rate for “always identifiers” was 49.6% in 2011 and 48.7% in 2016. So, there was actually worsening employment outcomes between 2011 and 2016 for this group, rather than the small increase that might be concluded from looking at the two censuses separately.
The complexity of identification change
Changes to the way people answer the census question on Indigenous origin not only changes official estimates of the size of the Indigenous population – it also changes the composition.
Compared to those previously identified in the census, those who are newly identified are more likely to:
be young;
live in NSW, Victoria or ACT;
likely to live in a major city;
be employed;
live in higher-income households; and
have higher rates of education.
The data do not tell us anything about the content or meaning of Indigenous identity, or who is or isn’t Indigenous. These data do not suggest changing identification in the census in any way leads to an improvement in outcomes, nor is that the motivation for people’s identification to change.
Rather, there are a range of social and familial reasons why some people may change their identification in the census. And the person who filled out a census form on behalf of someone in 2011 might be different to the person who filled out the form in 2016.
There should not be any intervention to reduce identification change; in fact it should be seen as a positive development. But identification change must always be always kept in mind when assessing the progress toward targets related to Indigenous Australians like Closing the Gap.
Authors: Nicholas Biddle, Associate Professor, ANU College of Arts and Social Sciences, Australian National University
Read more http://theconversation.com/three-charts-on-the-changing-status-of-indigenous-australians-92668