

How to flatten the curve of coronavirus, a mathematician explains
- Written by: Andrew Black, Lecturer in Applied Mathematics, University of Adelaide
People travelling into Australia will now have to self-isolate for 14 days – one of a range of measures announced at the weekend by Prime Minister Scott Morrison, with the aim of slowing the spread of the coronavirus and easing the stress on hospital beds.
This general concept of slowing the virus’s spread has been termed “flattening the curve” by epidemiologists – experts who study how often diseases occur in different populations, and why. The term has become widespread on social media as the public is encouraged to practise “social distancing”.
But how does social distancing help to flatten the curve? We can explain by referring to what mathematicians call “exponential growth”.
Exponential growth
In the early stages of an epidemic, when most people are susceptible to infection, mathematicians can model a disease’s spread from person to person as essentially a random “branching process”.
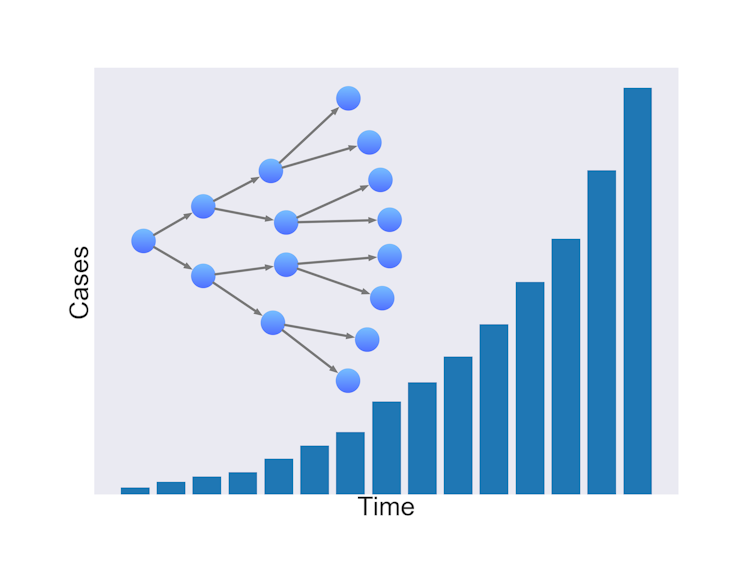 This diagram shows the number of cases, over time, in a branching process with exponential growth. Author Provided.
If one infected person infects two others on average, the number of infected people doubles each generation. This compounding is known as exponential growth.
Of course, an infected person is not definitely going to infect others. There are many factors affecting the likelihood of infection. In a pandemic, the growth rate depends on the average number of people one person can infect, and the time it takes for those people to become infectious themselves.
Read more: Coronavirus and COVID-19: your questions answered by virus experts
Research suggests the number of confirmed COVID-19 cases is growing exponentially worldwide with the number doubling about every six days
Exponential growth models closely match reality when starting with a small number of infected individuals in a large population, such as when the virus first emerged in Wuhan, or when it arrived in Italy or Iran.
But it’s not a good model once a large number of people have been infected. This is because the chance of an infected person contacting a susceptible person declines, simply because there are fewer susceptible people around, and a growing fraction of people have recovered and developed some level of immunity.
Eventually, the chances of an infected person contacting a susceptible person becomes low enough that the rate of infection decreases, leading to fewer cases and eventually, the end of the viral spread.
Flatten the curve
Health authorities around the world have been unable to completely prevent COVID-19’s spread. If cases double every six days, then hospitals, and intensive care units (ICUs) in particular, will be quickly overwhelmed, leaving patients without the necessary care.
But the growth rate can be slowed by reducing the average number of cases that a single case gives rise to.
In doing so, the same number of people will probably be infected, and the epidemic will last longer, but the number of severe cases will be spread out. This means that if you plot a graph of the number of cases over time, the rising and falling curve is longer but its peak is lower. By “flattening the curve” in this way, ICUs will be less likely to run out of capacity.
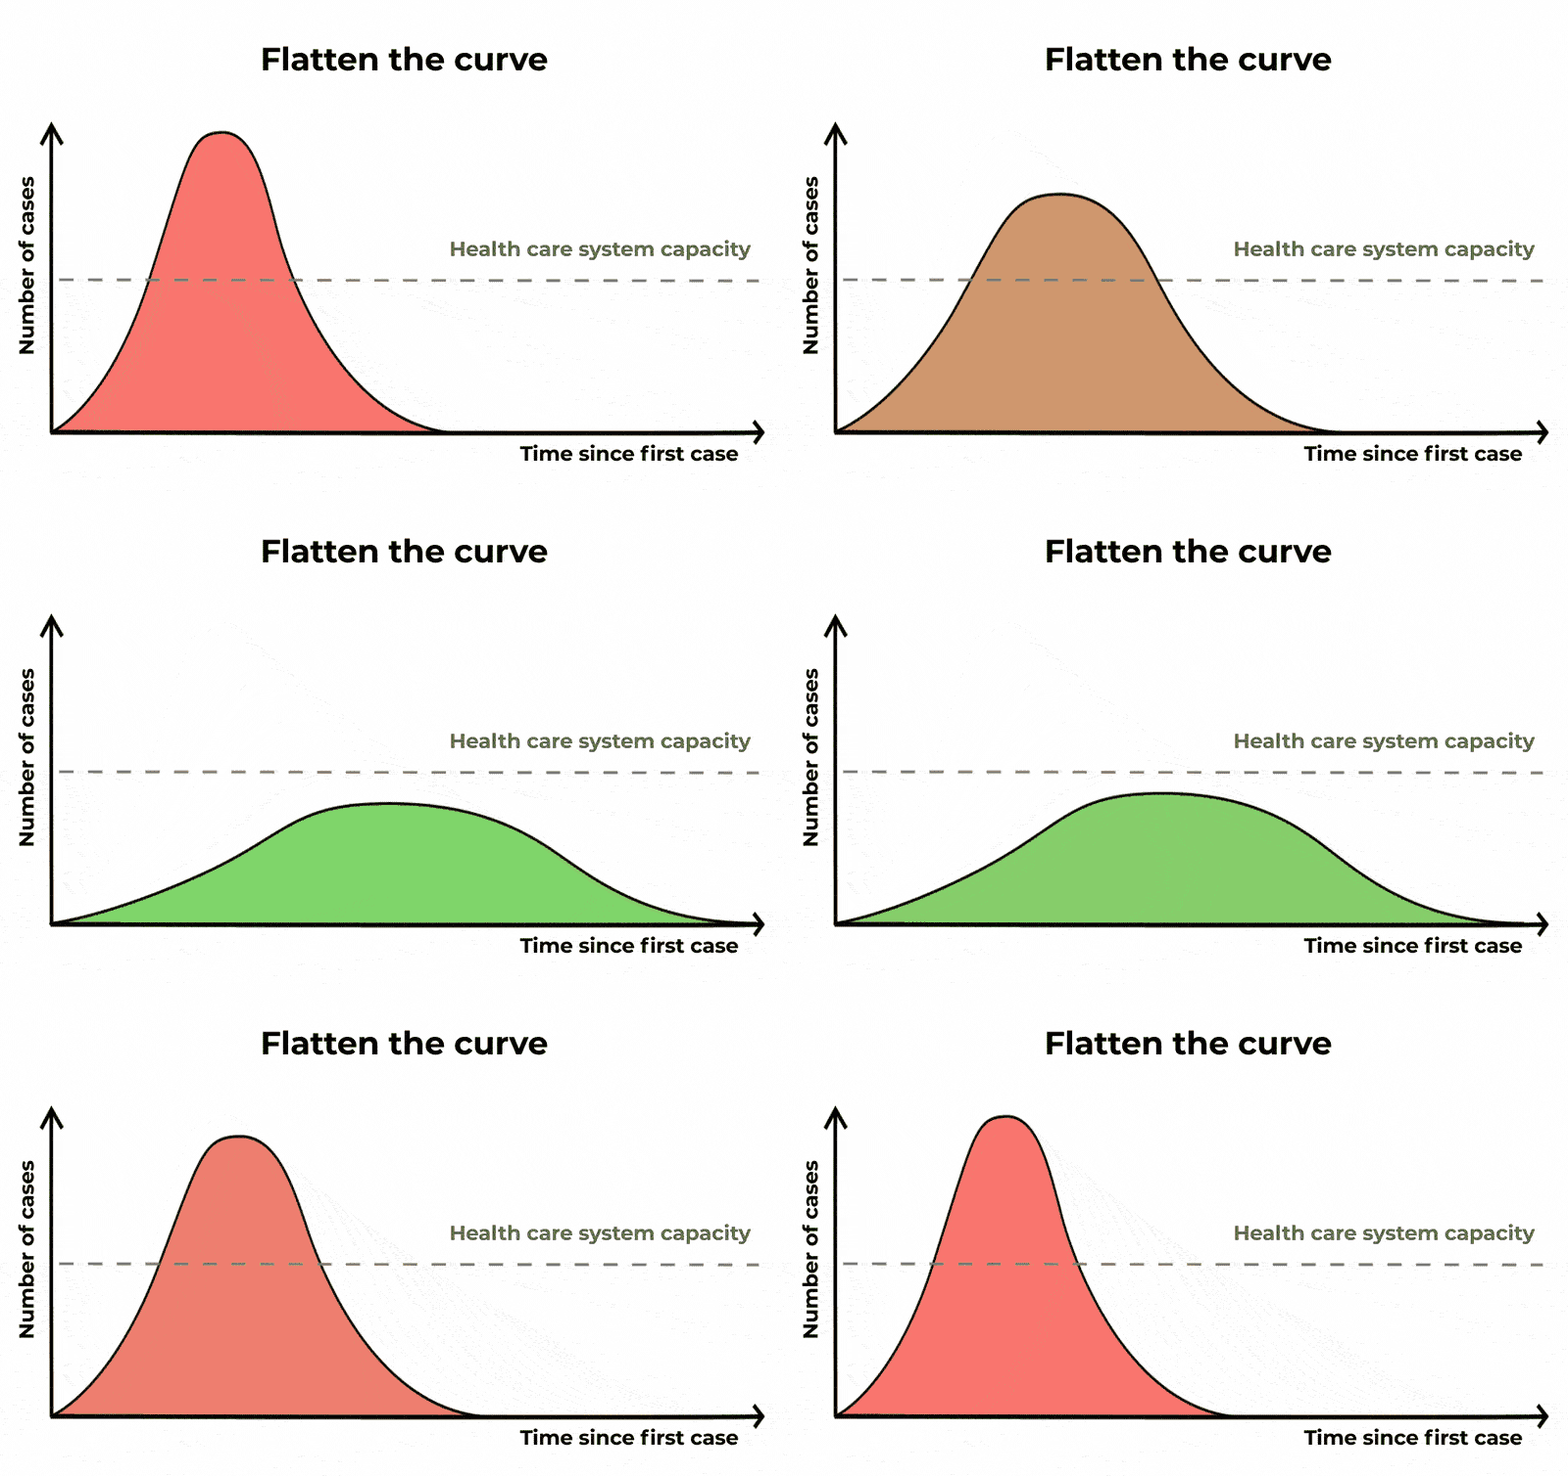 Flattening the curve is another way of saying slowing the spread. The epidemic is lengthened, but we reduce the number of severe cases, causing less burden on public health systems. The Conversation/CC BY ND
As there is currently no vaccine or specific drug for COVID-19, the only ways we can reduce transmission is through good hygiene, isolating suspected cases, and by social distancing measures such as cancelling large events and closing schools.
Avoid “super-spreaders”
Of course, the situation is not quite as straightforward as a simple branching process. Some people interact more than others, and might come into contact with many different groups.
Read more: There's no evidence the new coronavirus spreads through the air – but it's still possible
Mathematicians model these connections as a social network, such as the one below. Infected people are red nodes, and susceptible people are blue. The large node in the middle of the diagram is a super-spreader, a person who connects with many others, and thus has more potential to spread the disease.
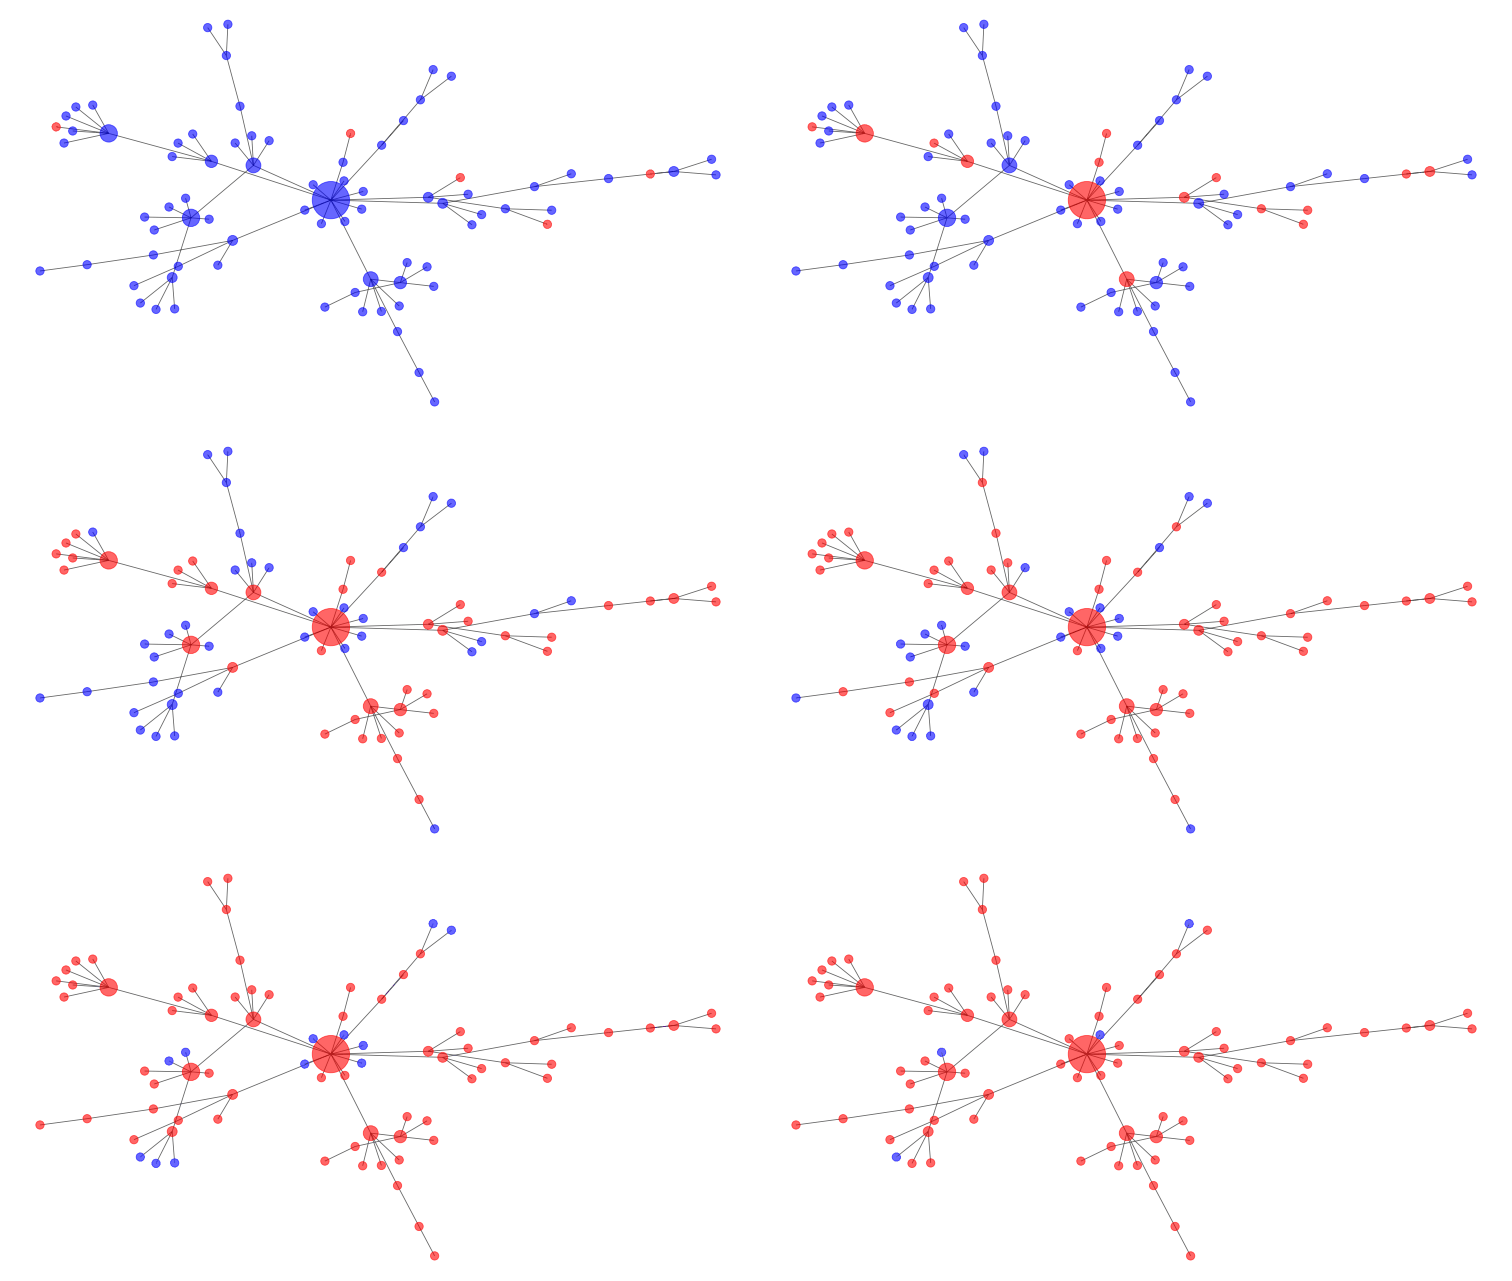 This graph shows how an epidemic might spread across a network over time. Blue dots are susceptible individuals, while red dots are infected people. Two dots are connected by a line if they are in contact with each other, and the more contacts a person has, the bigger their dot is on the network. Author provided
 Interventions help remove nodes and break connections.
In the diagram above, the large, highly connected central node would be the best one to remove to break connections. This is why it’s a good idea to avoid large public gatherings during the COVID-19 outbreak.
Mathematical simulations of social distancing have shown how breaking the network apart helps flatten the curve of infection.
How maths is helping
How much social distancing is required to flatten the curve enough to stop hospitals being overwhelmed? Is it enough to quarantine people who have been in contact with confirmed cases? Do we need widespread closure of events, schools and workplaces?
Answers to these questions require mathematical modelling.
We are still in the early stages of the COVID-19 outbreak and there is great uncertainty about the characteristics of this virus. To accurately forecast COVID-19’s growth, the underlying dynamics of transmission need to be determined.
These are driven by factors including:
- How many people on average does an individual infect? (the “reproduction number” which, according to the World Health Organisation, is currently between 1.4–2.5 people)
- How long until the onset of symptoms? (the “incubation period”, which is estimated to be 5.1 days)
- What proportion of transmission occurs prior to the onset of symptoms, if any?
As such data is collected and integrated into models over the coming months, we will be better placed to offer accurate predictions about the course of COVID-19.
Until then, it’s better to err on the side of caution and take swift action to slow transmission, rather than risk a spike in cases, and put strain on our health system.
Authors: Andrew Black, Lecturer in Applied Mathematics, University of Adelaide
Read more https://theconversation.com/how-to-flatten-the-curve-of-coronavirus-a-mathematician-explains-133514