

More testing will give us a better picture of the coronavirus spread and its slowdown
- Written by: Haydar Demirhan, Senior Lecturer in Analytics, RMIT University
Many states are now ramping up the number of tests by relaxing the criteria for who can get tested for COVID-19. This should give us a better idea of whether the spread is easing or getting worse.
We get regular updates about COVID-19 with lots of data, figures and graphs with some interpretations to see if we are flattening the curve on the number of new cases.
But most of these are based on using only the total or the daily number of confirmed new cases.
This does not provide enough information about whether the situation is improving, stabilising or getting worse. That is why we also need to consider the number of people tested daily for COVID-19.
For example, in percentage terms there is no actual difference between getting 20 positive cases out of 1,000 tests one day and 100 positive cases out of 5,000 tests the next. Both lead to the conclusion we have 2% reported infected people of those tested.
If we are only given the number of new cases, getting 100 in a day sounds a lot worse than getting 20. The 2% percentage figure here tells us things are pretty much the same over the two days.
Curves and trends
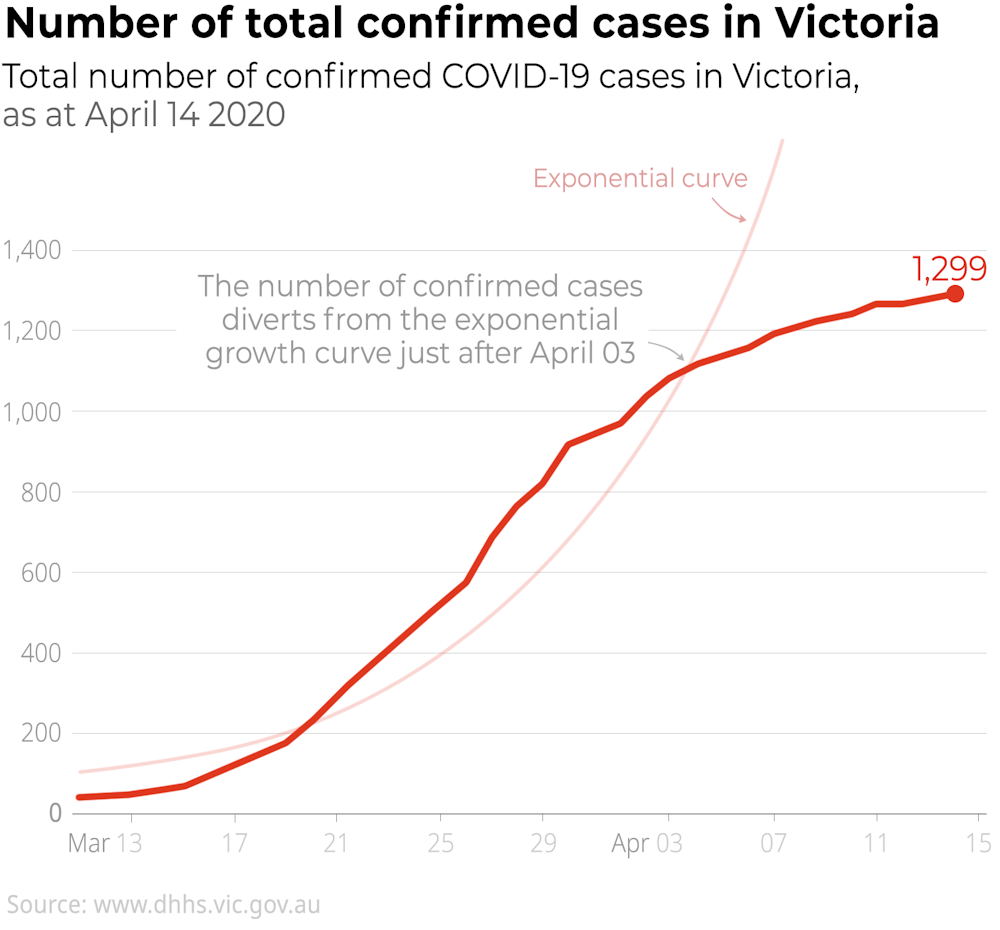
Take Victoria, if we look at the total number of confirmed cases we see it followed an exponential trend for a while – one that was increasingly rising – and then started to divert on April 3.
 The Conversation, CC BY-ND
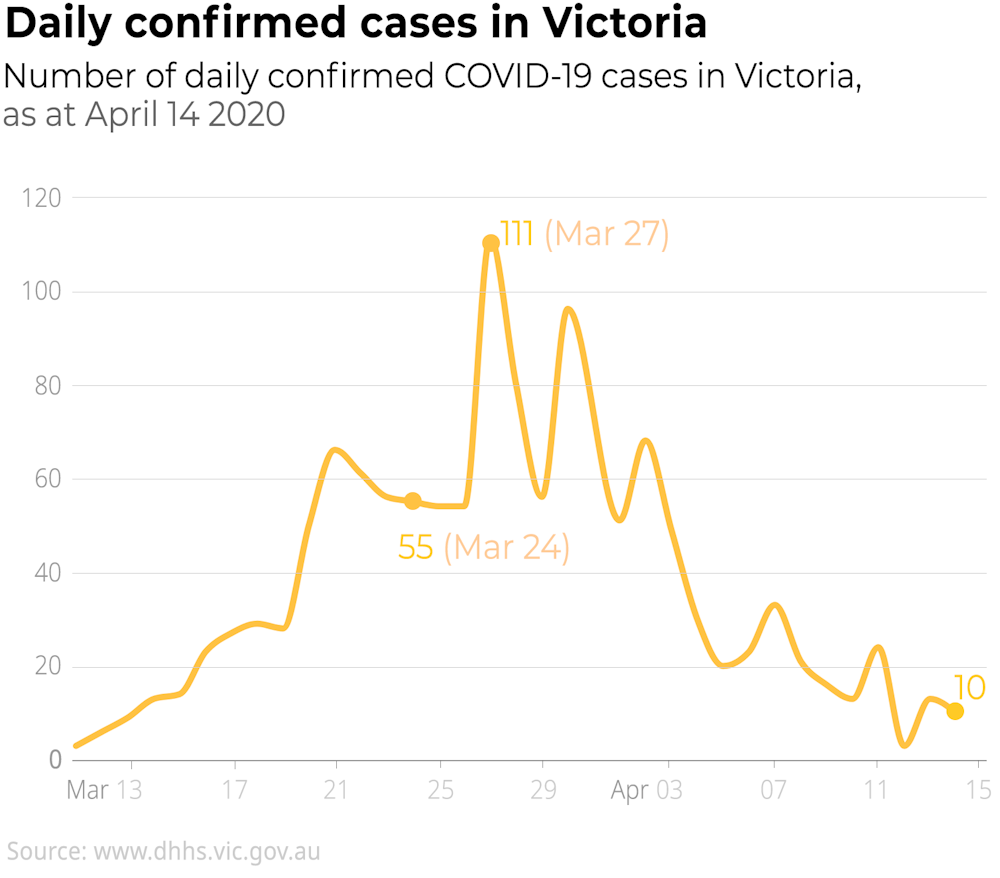
In the daily number of confirmed cases we see high jumps and large fluctuations going back and forth.
The Conversation, CC BY-ND
In the daily number of confirmed cases we see high jumps and large fluctuations going back and forth.
 The Conversation, CC BY-ND
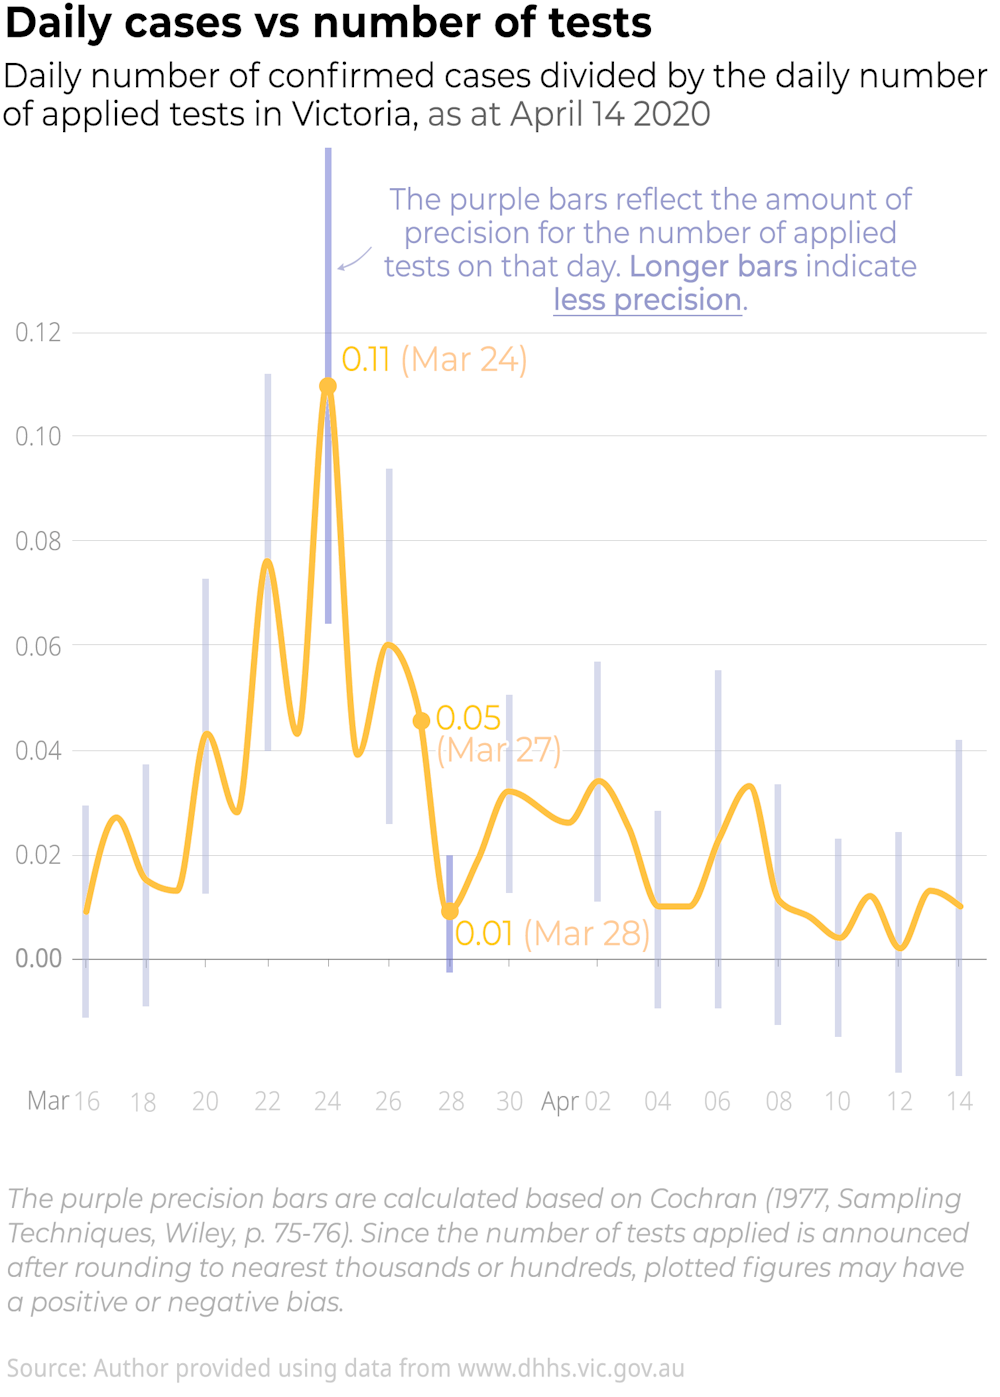
When the daily number of applied tests is considered, we can calculate the actual percentage of new cases each day. Now we have a way flatter curve (below) with different fluctuations.
The Conversation, CC BY-ND
When the daily number of applied tests is considered, we can calculate the actual percentage of new cases each day. Now we have a way flatter curve (below) with different fluctuations.
 The Conversation, CC BY-ND
The peak is now on March 24 when the number of tests is included. If we just look at the daily count, the highest number of confirmed cases was on March 27. When we look at the percentage, it shows a decrease rather than an increase with more than 2,300 tests.
From the daily new cases data it looks like there is a strongly decreasing trend in the number of confirmed cases between April 2 and 6.
But we do not see the same strong downward movement in the percentage data on the number of tests. Although both figures go down, then up slightly, the percentage trend downward is not as strong as the daily trend.
This is a good example of the discrepancy between the inferences from the raw and percentage data. When we consider the number of tested people, we get a different view on the progress of the pandemic.
More tests needed
In using the number of tests to get a more reliable picture of the situation, there is an important point to consider. That’s were the purple error bars in the graph (above) come in.
They show the margin of error where each percentage estimate swings for the daily number of applied tests, so the actual number could be higher or lower but within those purple bars.
When we have a larger number of applied tests, we get a reduced margin of error, and that gives us a clearer picture of what is happening.
Read more:
Even in a pandemic, continue with routine health care and don't ignore a medical emergency
Since the peak on March 24 is backed up by only 500 tests, it has the largest margin of error. The figure on March 28 is based on 8,900 tests with a very small amount of error.
To get a more reliable picture of the situation, the number of applied tests has to be expanded, which it is what is happening in some states. This should reduce the margin of error.
Out in the community
After getting some signals of flattening the curve in Victoria and Australia as well, do we see an exponential increase in just the community transmission?
Community transmission is where someone has caught the virus locally, not an infected traveller who’s returned from a cruise or overseas. At the moment they are the minority of cases and authorities would like it to stay that way to contain the spread of the virus.
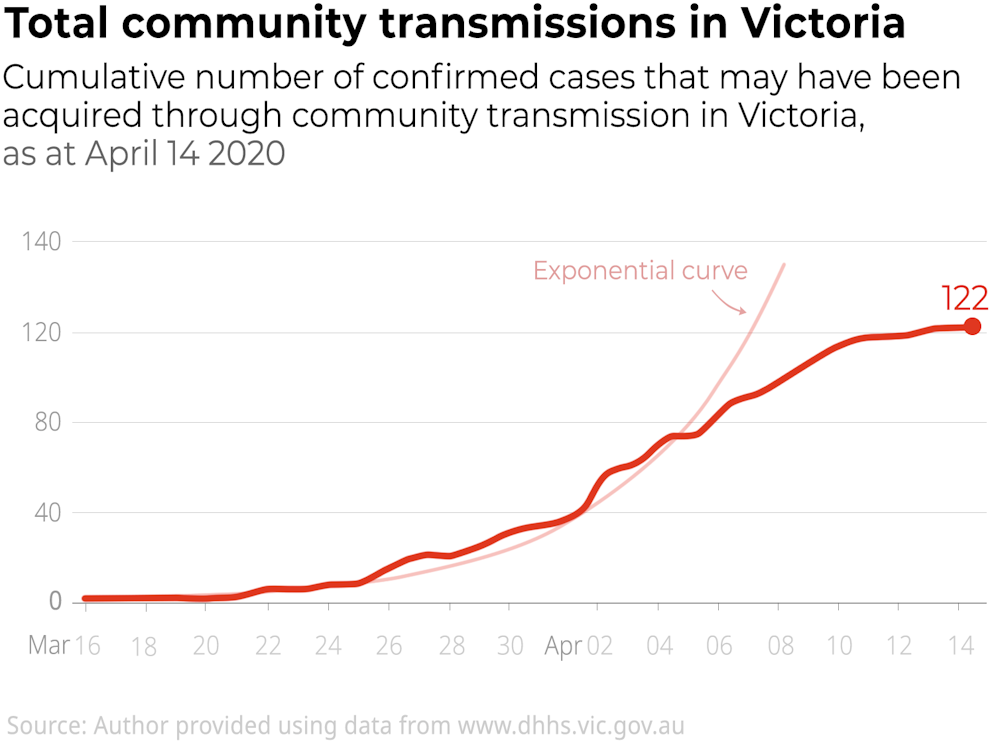
Again, we need to consider the number of tests to answer this question clearly. The raw numbers of community transmission in Victoria looked like they were increasing exponentially.
The Conversation, CC BY-ND
The peak is now on March 24 when the number of tests is included. If we just look at the daily count, the highest number of confirmed cases was on March 27. When we look at the percentage, it shows a decrease rather than an increase with more than 2,300 tests.
From the daily new cases data it looks like there is a strongly decreasing trend in the number of confirmed cases between April 2 and 6.
But we do not see the same strong downward movement in the percentage data on the number of tests. Although both figures go down, then up slightly, the percentage trend downward is not as strong as the daily trend.
This is a good example of the discrepancy between the inferences from the raw and percentage data. When we consider the number of tested people, we get a different view on the progress of the pandemic.
More tests needed
In using the number of tests to get a more reliable picture of the situation, there is an important point to consider. That’s were the purple error bars in the graph (above) come in.
They show the margin of error where each percentage estimate swings for the daily number of applied tests, so the actual number could be higher or lower but within those purple bars.
When we have a larger number of applied tests, we get a reduced margin of error, and that gives us a clearer picture of what is happening.
Read more:
Even in a pandemic, continue with routine health care and don't ignore a medical emergency
Since the peak on March 24 is backed up by only 500 tests, it has the largest margin of error. The figure on March 28 is based on 8,900 tests with a very small amount of error.
To get a more reliable picture of the situation, the number of applied tests has to be expanded, which it is what is happening in some states. This should reduce the margin of error.
Out in the community
After getting some signals of flattening the curve in Victoria and Australia as well, do we see an exponential increase in just the community transmission?
Community transmission is where someone has caught the virus locally, not an infected traveller who’s returned from a cruise or overseas. At the moment they are the minority of cases and authorities would like it to stay that way to contain the spread of the virus.
Again, we need to consider the number of tests to answer this question clearly. The raw numbers of community transmission in Victoria looked like they were increasing exponentially.
 The Conversation, CC BY-ND
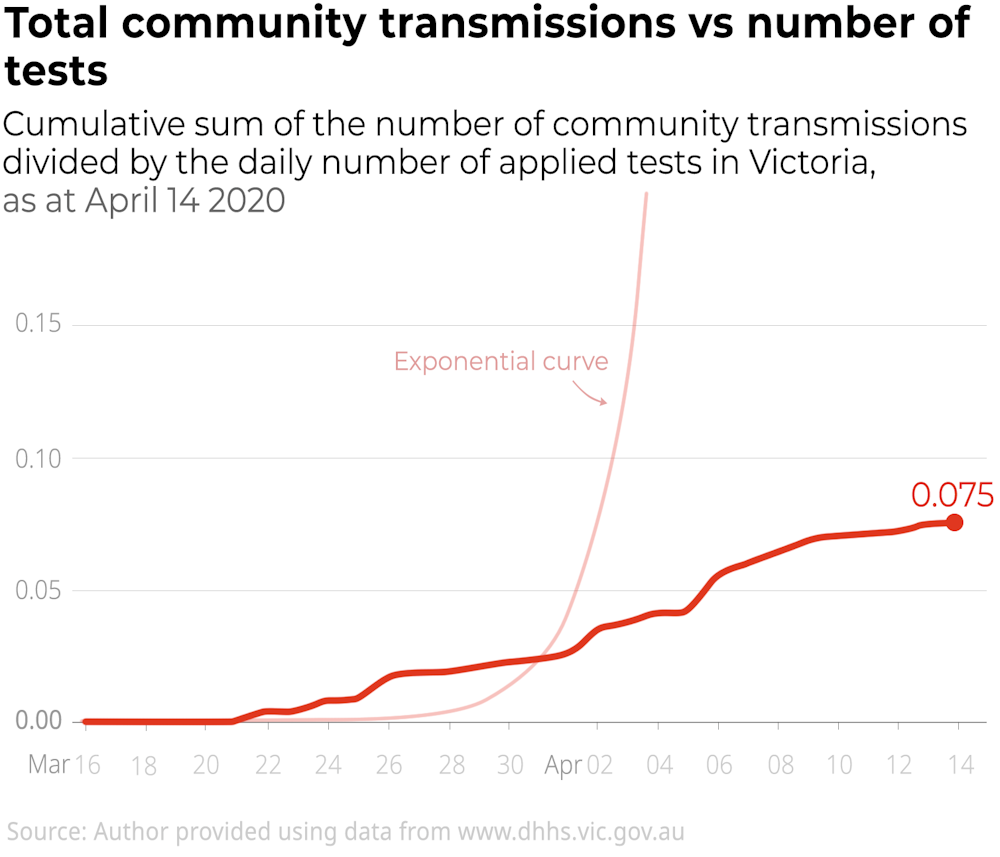
But the numbers as a percentage of the number tested tell a different story. Although there is some increase in the rate of community transmissions recently, it still shows a way flatter behaviour far from the exponential curve.
The Conversation, CC BY-ND
But the numbers as a percentage of the number tested tell a different story. Although there is some increase in the rate of community transmissions recently, it still shows a way flatter behaviour far from the exponential curve.
 The Conversation, CC BY-ND
That is why it is important to understand the impact of the number of tests on the figures displaying the progress of the pandemic. Understanding this relationship could reassure people about new numbers.
The Conversation, CC BY-ND
That is why it is important to understand the impact of the number of tests on the figures displaying the progress of the pandemic. Understanding this relationship could reassure people about new numbers.
Authors: Haydar Demirhan, Senior Lecturer in Analytics, RMIT University