New Zealand’s urban freshwater is improving, but a major report reveals huge gaps in our knowledge
- Written by Troy Baisden, Professor and Chair in Lake and Freshwater Sciences, University of Waikato
Environment Aotearoa 2019, a major report released today, provides the first snapshot since 2015 of New Zealand’s environment across five “domains” – air, climate, freshwater, land and ocean.
This is the first synthesis report produced under environmental reporting legislation that came into effect in 2016. Here, I’ll focus on freshwater and how this report updates an earlier assessment of freshwater quality in 2017.
Sadly, the standout message is the scale and importance of the gaps in the data on environmental change. Trends in a range of water quality attributes have been re-assessed, but the causes remain poorly understood. This is mostly because of a lack of a “national-scale database or map of farm management practices”.
Gaps in understanding
The gap widens when assessing impacts of changing water quality on “things we value”, including te ao Māori (Māori world), ecological health and human health. Despite having over 500 sites evaluated for contamination trends, only 41 sites have data for a cultural health index assessing Māori interactions with water.
This is concerning because the dual goals for this synthesis report were to assess pressures on the environment as well as the resulting impacts.
In many cases, the data can’t help us detect recent change. Data and maps for land cover and erosion date to 2012. In other cases, the data presented is very coarse, but tells a compelling story that pollution has been significant.
When compared to native land cover, agriculture yields 2.2 to 9.7 times higher concentrations of contaminants. Urban areas have concentrations 3.3 to 30 times higher.
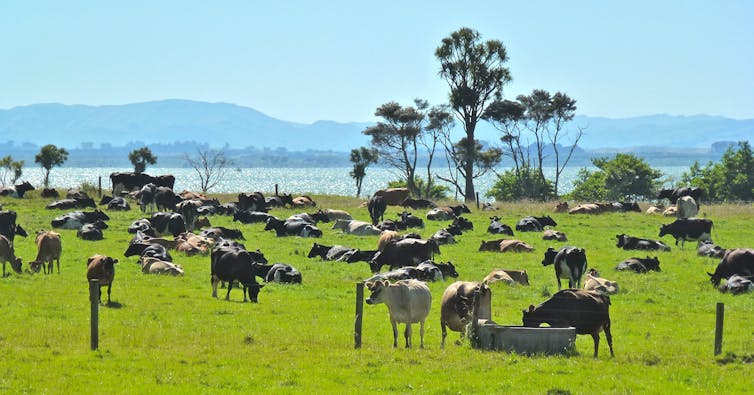 Compared to native land cover, agriculture contributes 2.2 to 9.7 times higher concentrations of contaminants.
Troy Baisden, CC BY-ND
Compared to native land cover, agriculture contributes 2.2 to 9.7 times higher concentrations of contaminants.
Troy Baisden, CC BY-ND
What’s changing
Changes for animal numbers (separated into dairy cattle, beef cattle, and sheep) show meaningful trends that differ on the North and South islands. Modelled estimates show that the dairy sector contributed 39% of nitrate leaching in 1990, which increased to 65% in 2017.
But water quality data is presented in a format where the main story is nearly equal numbers of increasing and declining trends in water quality. The use of modelled water quality data obscures useful detail. The report’s model results suggest streams and rivers don’t presently exceed toxic nitrate concentrations. But the dataset unpinning the analysis has sites that clearly exceed this limit.
 CC BY-ND
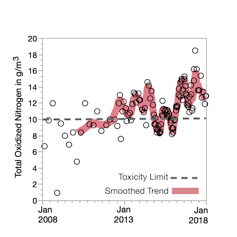
For instance, consider Boundary Drain at Trigpole Rd, a small 15km long catchment crossing State Highway 1 on the Canterbury Plains midway between Ashburton and Geraldine.
This catchment has a five-year median well above a threshold of 6.9 g/m³ and has had no results in the last two years of data (2016-17) under the 10 g/m³ commonly used worldwide as a drinking water toxicity threshold. Making a chart from the data for this site presents quite a different view from the general story in Environment Aotearoa 2019.
Only by looking at sites that exceed limits, or will do so soon, can we better understand how to use environmental reporting to help us live sustainably. This will be even more important as we apply more stringent limits for cultural and ecological health across multiple contaminants, as well as dealing with further pressures from expanded irrigation and climate change.
Read more:
Six ways to improve water quality in New Zealand's lakes and rivers
Old news and suprises
One danger of repeating rather than updating information in environmental reports is that it reinforces excuses for not taking action. The report correctly points out that slow passage of contaminants through groundwater can delay the impacts of land use by years or decades. It quotes average lags calculated for water entering Lake Rotorua of 50 years or more. These estimates make recovery seem impossible, but recent updates suggest otherwise by using models that more accurately represent how water moves. This shows improvements in nitrate concentration trends in streams with very old water and suggests that restoration work has halted algal blooms in the lake.
Overall, the report gives a sense that change has occurred over decades, and faster change is possible only if we can overcome knowledge gaps to sharpen our focus. Along these lines, the report provides a surprise with a strong indication of improvements in urban freshwater trends from 2008 to 2017, with 75% of sites showing better measures for clarity and nutrient loads. Many voices in the farming sector have pointed at the poor state of urban water quality as a reason for inaction on rural streams and rivers. Urban water remains polluted, compared to native land cover, but there are now indications improvements are possible.
The report could do more to clarify how gaps can be filled, particularly at the interfaces between domains such as how the land influences freshwater. It is silent on the Parliamentary Commissioner for the Environment’s recent report on a farm nutrient monitoring system called Overseer, and future needs for quantifying land-to-water transfers, including improved statistical methods to track how contaminants move through the environment. Such work can also clarify transfers between other domains, including how nutrient and contaminant loads move via surface and groundwater to estuaries, coasts and harbours.
The report is honest about the challenge these gaps pose. But the ministries responsible for producing this report use data funded and created by other agencies, such as regional council monitoring. Clearer messages from the Ministry for the Environment can help coordinate these agencies to provide a clearer picture in three years’ time, when the next synthesis report is due.
CC BY-ND
For instance, consider Boundary Drain at Trigpole Rd, a small 15km long catchment crossing State Highway 1 on the Canterbury Plains midway between Ashburton and Geraldine.
This catchment has a five-year median well above a threshold of 6.9 g/m³ and has had no results in the last two years of data (2016-17) under the 10 g/m³ commonly used worldwide as a drinking water toxicity threshold. Making a chart from the data for this site presents quite a different view from the general story in Environment Aotearoa 2019.
Only by looking at sites that exceed limits, or will do so soon, can we better understand how to use environmental reporting to help us live sustainably. This will be even more important as we apply more stringent limits for cultural and ecological health across multiple contaminants, as well as dealing with further pressures from expanded irrigation and climate change.
Read more:
Six ways to improve water quality in New Zealand's lakes and rivers
Old news and suprises
One danger of repeating rather than updating information in environmental reports is that it reinforces excuses for not taking action. The report correctly points out that slow passage of contaminants through groundwater can delay the impacts of land use by years or decades. It quotes average lags calculated for water entering Lake Rotorua of 50 years or more. These estimates make recovery seem impossible, but recent updates suggest otherwise by using models that more accurately represent how water moves. This shows improvements in nitrate concentration trends in streams with very old water and suggests that restoration work has halted algal blooms in the lake.
Overall, the report gives a sense that change has occurred over decades, and faster change is possible only if we can overcome knowledge gaps to sharpen our focus. Along these lines, the report provides a surprise with a strong indication of improvements in urban freshwater trends from 2008 to 2017, with 75% of sites showing better measures for clarity and nutrient loads. Many voices in the farming sector have pointed at the poor state of urban water quality as a reason for inaction on rural streams and rivers. Urban water remains polluted, compared to native land cover, but there are now indications improvements are possible.
The report could do more to clarify how gaps can be filled, particularly at the interfaces between domains such as how the land influences freshwater. It is silent on the Parliamentary Commissioner for the Environment’s recent report on a farm nutrient monitoring system called Overseer, and future needs for quantifying land-to-water transfers, including improved statistical methods to track how contaminants move through the environment. Such work can also clarify transfers between other domains, including how nutrient and contaminant loads move via surface and groundwater to estuaries, coasts and harbours.
The report is honest about the challenge these gaps pose. But the ministries responsible for producing this report use data funded and created by other agencies, such as regional council monitoring. Clearer messages from the Ministry for the Environment can help coordinate these agencies to provide a clearer picture in three years’ time, when the next synthesis report is due.
Authors: Troy Baisden, Professor and Chair in Lake and Freshwater Sciences, University of Waikato